Lecture 24: Macroevolution
Lecture 24: Macroevolution
Almost all professional football players are still alive. 4% of all human beings that have ever lived are still alive. What percent of all species that have ever lived are still alive? 0.1%; thus 99.9 % are extinct. Looking ahead, things look numerically bad for humans: chances are that we will go extinct.
What is extinction? Ultimately we want it to be the termination of a lineage. What are the units of extinction? Given a paleontological record, would be it be tax at the level of Genus or Family that is important? Do we determine extinction of a genus by the last remaining species that makes up that genus? What happens if 99% of the genus goes extinct and one “hanger-on” last millions of more years? No solution to the problem, these are the sorts of biases that are inherent in tabulating higher-level phenomena.
What can we say about adaptation and extinction rates? Is extinction due to simple chance or rather does it say something about the fitness of the organism?
As to the causes of extinction here are some questions to “ask” the fossil record:
intrinsic/extrinsic factors: was extinction due to a characteristic of the organism (intrinsic) or of the physical environment (extrinsic)? Was extinction due to competition (mutituberculates and rodents) or was it due to major events like sea level changes or asteroid impact? One “asks” the fossil record by looking at the data.
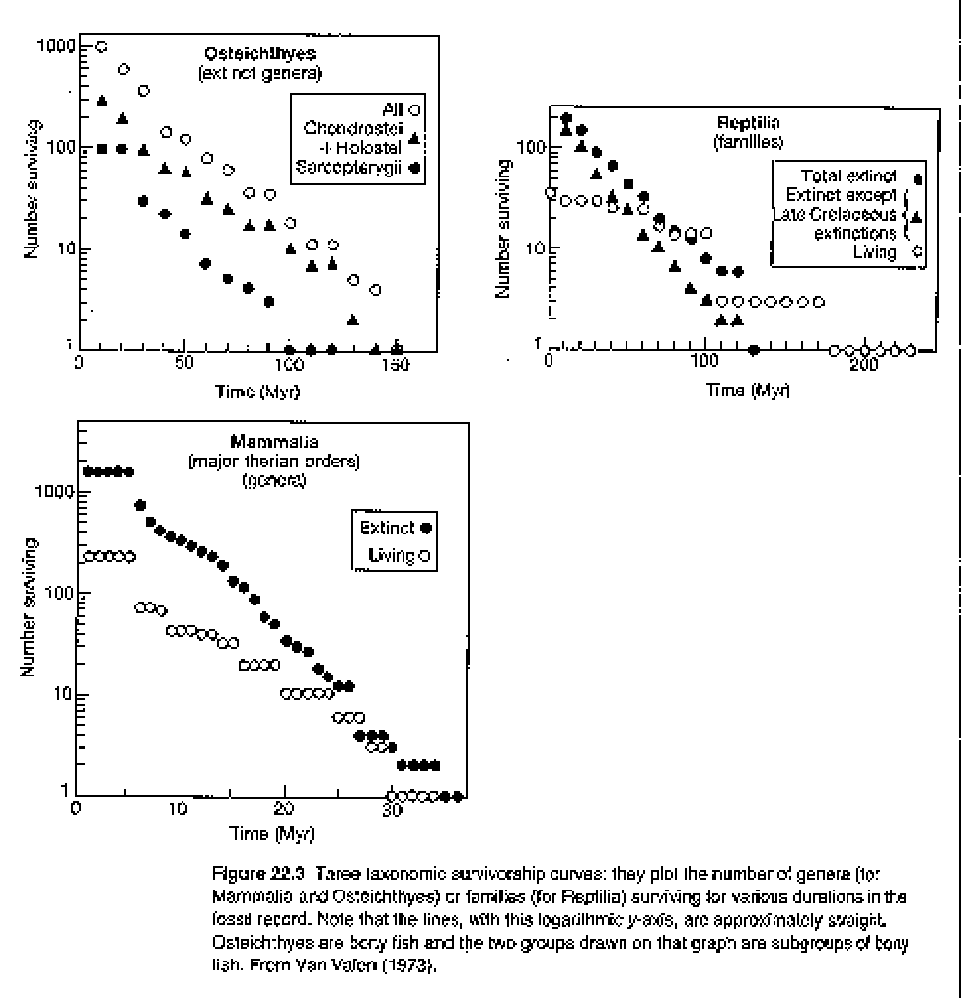
Taxonomic survivorship curves were tabulated by Van Valen, U. Chicago
(see redqueen).
Horizontal axis in the number of years that a group has survived (could be 50 Myr. in the Cenozoic or 50 Myr. in the Paleozoic); vertical axis in the log of the number of taxa that survived for the stated number of years. The \(\sim\) straight lines indicate that a constant proportion of the taxa are becoming extinct at various stages of duration, which Van Valen interpreted to mean that the probability of extinction is independent of age of taxon. This further implies that taxa are not becoming better adapted (if one defines increased adaptedness as a decreasing probability of going extinct). Note that these survivorship curves are different than the ones presented for moluscs and carnivores. Note also that the graphs do not imply that there is a constant extinction rate per unit time. The approximately linear relationship indicates that the taxa with a long duration do not appear more resistant to extinction.
Van Valen proposed the Red Queen hypothesis to account for the pattern of approximately linear survivorship curves. Van Valen hypothesized that
the environment is continually deteriorating (\(\sim\) changing so that current adapted state is no longer applicable), 2) organisms have to adapt continually, i.e., you have to “run to stay in place” like the Red Queen said to Alice in Through the Looking Glass (Alice in Wonderland).
There are other ways of looking at extinctions that contradict this idea. Extinction rates in the Phanerozoic show a pattern of decrease in background extinction rate (see figure below; “background” means excluding the five big peaks). Does this mean that species are becoming more adapted because they are more resistant to extinction? The jury is still out (i.e., we don’t know). Moreover, some data sets show rates of extinction that vary dramatically over absolute time, suggesting that extinction rates are not constant over time but vary widely.
One interesting observation about extinction patterns is that a periodicity has been documented in one data set. The cycle appears to be 26 million years. Explanations for periodicity have been varied: Silliest idea– Unseen companion death star beyond the Oort cloud cycling past earth every 26 million years which hurls asteroids at earth killing many taxa. Needless to say, this idea didn’t pan out.
Mass extinctions are quite a different type of extinction than the background extinctions. In some regards mass extinctions rekindled ideas of Catastrophism (as opposed to Uniformitarionism; see lecture 2). The impact extinction theory that mass extinctions were indeed caused by asteroid (or other) impact is a good one because it falls into the mainstream of scientific inquiry: an hypothesis that can be tested, and falsified, with further sampling or experimentation (although conclusive proof that it did not happen may be difficult).
The Cretaceous-Tertiary (K/T) Extinctions are some of the best studied. What went extinct? marine reptiles, ammonites, dinosaurs, etc. However, many groups were relatively unaffected. This presents an interesting problem: how could something that might be so devastating as to kill off many diverse taxa be, at the same time, so selective with respect to different taxa?
The Alvarezs from Berkeley proposed that the K/T extinctions were caused by impact of a large asteroid. Some compelling evidence supports the notion: Excess of iridium (iridium anomaly or iridium “spike”) at the K/T boundary (see fig. 23.6, pg. 649). This element is rare in earth’s crust, but not uncommon in meteorites. The presence of “shocked” quartz (likely to be formed at asteroid impact, less likely to be formed by normal Earthly geological processes) is also in excess at the K/T. Evidence for these diagnostic markers of impact have been sought at the other “big five” mass extinctions and only one has any blip of excess iridium (no where near the spike at the K/T).
There are some problems with the impact explanation: why was it so selective? and was this the result of Chicxulub impact or something else? Keller et al 2004 data suggest impact 300k years before K/T boundary– was it increased vulcanism instead? Lots of evidence for this as well at this point.
The issue of impact extinction puts all that we learned about population genetics and adaptation in a very different perspective. So what if one allele is more fit than another, or the rate of evolution depends on the amount of additive genetic variation in the population, if an asteroid is going to blow us away tomorrow, then microevolution really is decoupled from macroevolution. But what about those lineages that sail through the K/T boundary unaffected? Maybe they were adapted, pre-adapted or just exapted for the impact and there is a coupling.